Hello,
thank you for your ongoing work maintaining this amazing resource.
My problem:
up until a few days ago, when going to the card of a gene called AXIN1, I could see that it was critical for the growth of AML cell lines, with a p=7.41e-6 for CRISPR gene dependency. Now, on this gene card I just see “Other Heme” as a relevant dependency. I am encouraged to explore more in Context explorer. Yet, clicking on the linked Context Explorer does not take me to a page in any way related to the gene that I have just looked at. When searching for AXIN1 in context Explorer, looking only at AML cell lines, I am not able to observe the dependency of AML cell lines on AXIN1 that I have seen just a few days ago.
From my personal perspective, removing the more detailed summary from the Gene Dependency of each gene page (i.e. a list of lineages with corresponding n and a p value) is a downgrade. The previous list of lineages and cell lines was easier to scan quickly, and also appeared more detailed. I now have to manually search (and as of now, fail to find) for the same information manually via going to context explorer.
I would like to put a gene name in and know what lineages are and aren’t dependent this gene. I can’t see an easy way of doing it now.
Second issue (and the one I worry about) is that the dependencies are not the same as few days ago. This might stem from my inability to recapitulate in Context Explorer what has been previously presented to me. I would appreciate guidance here.
I think the disappearance of many of the results I have seen in the past is the consequence of changing your batching or regularisation strategy. Having now reviewed data for many genes whose behaviour I am familiar with - either from literature or my past research experience - I believe your Q3 analytical pipeline has led to removal very many true effects, and that the Q2 data was in fact more accurate.
Is there any way to access Q2 data?
From my personal perspective, this tool moved from very useful, to being of no use. Having access to Q2 data would be of great help.
The 25Q2 data is downloadable from the portal at Data | DepMap Portal however, the portal itself only shows the current release.
The enriched lineages tile is now reporting contexts in which we see enrichment using an updated methodology which should have fewer false negatives. However for AXIN1, it’s now only showing distributions for “other solid” and “other heme” which, I believe, is what’s shown if no significant enrichments were found in any context. We probably should make the tile more explicit in communicating that “no enrichments were found” to avoid confusion.
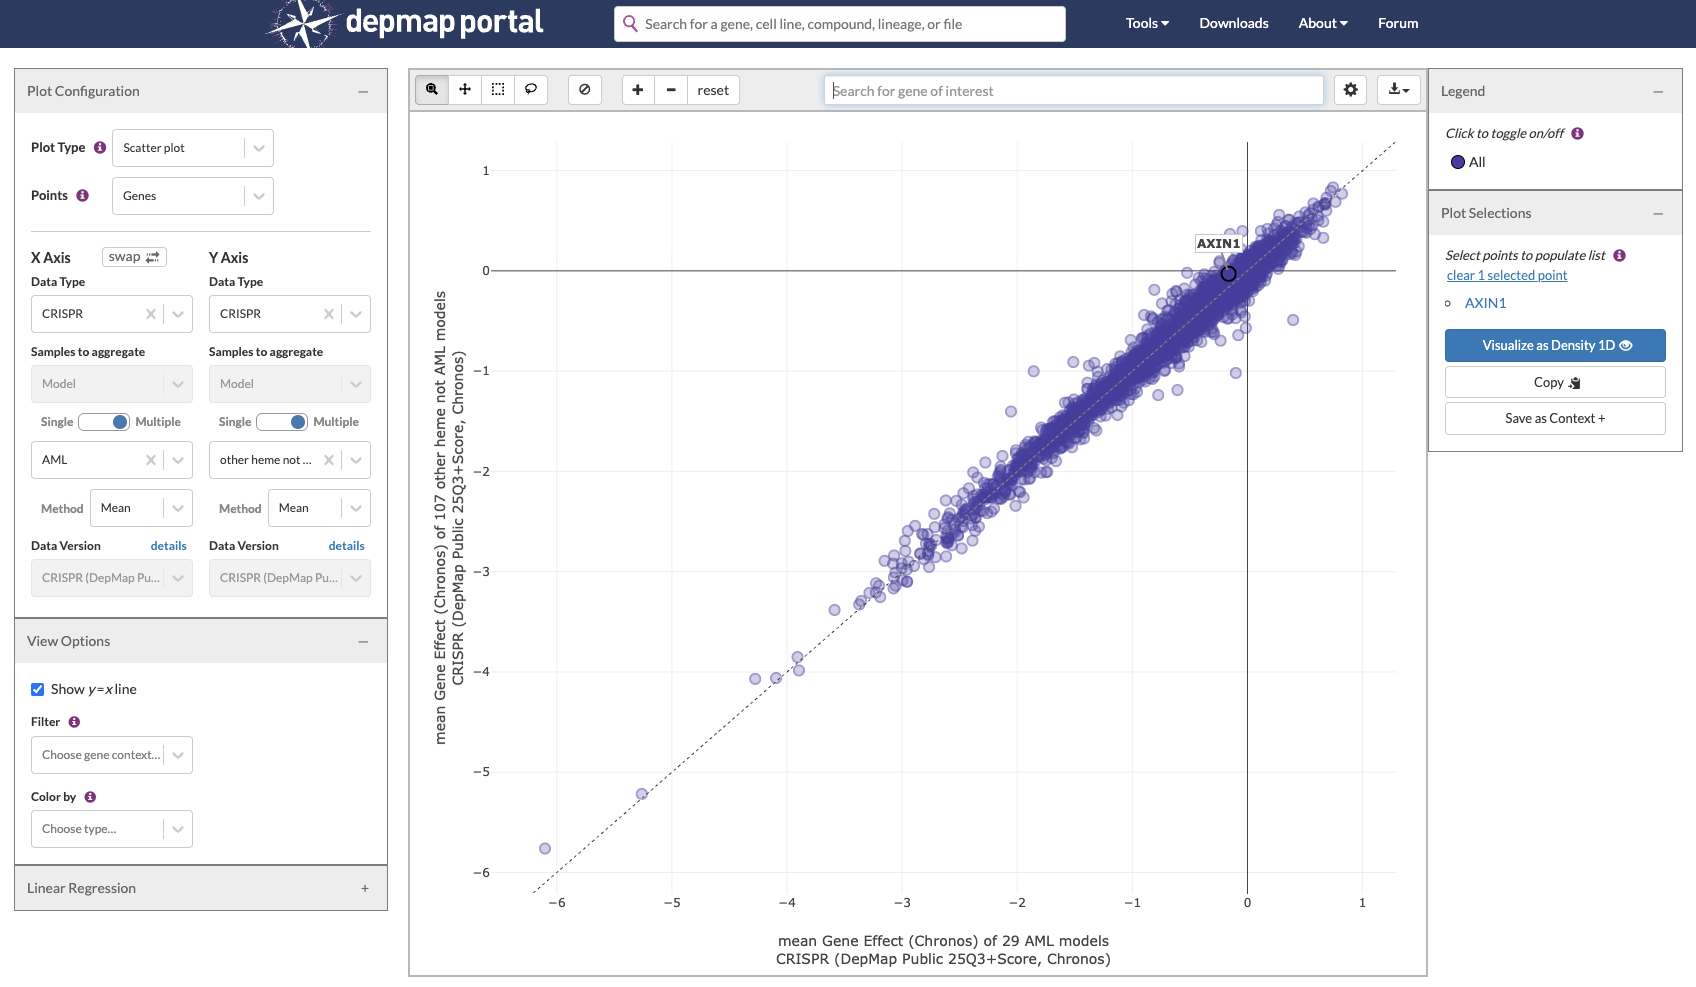
I was curious whether this enrichment was likely due to the change in the data or the change in methodology. When I compared the dependency of AML lines and non-AML heme lines, AXIN1 appeared fairly close to the x=y line, suggesting that if you saw enrichment before, it’s likely not reporting an enrichment now due to the changes in the data and not the methodology.
I raised your concern that many true effects have been removed in the Q3 processing of the data and they are taking a second look to see if there’s something that escaped our standard release QC process. On average the results are very similar to the 25Q2 gene effect scores with only ~600 genes having < 0.94 correlation (and only one with < 0.7) between the 25Q2 and 25Q3 data so the differences you are seeing are probably visible in specific analyses or specific genes.
Such specific examples are very helpful to assist us in our investigation for potential problems. Would you be willing to share any examples which behave differently then expected beyond AXIN1?