Dear DepMap members, I am interested in checking the drug sensitivity of melanoma lines to atorvastatin drug and other drugs in relation to the LDLR protein levels. In the past I used to see the options from the drop down menu to see the response LDLR vs statins (I am attaching a screenshot) or with the the drugs but I do not see this option now. Please let me know how to use access this if the way to access this information has been changed now.
Thanks so much.
Best, VJ

Are you saying this is a screen shot of a plot that you cannot generate any more, or something different?
It’s possible that the dataset you’re missing is because we created new “harmonized” versions of our proteomic datasets which are indexed by UniProtID. (Previously different proteomics data was indexed by different indentifiers, but we remapped everything to UniProtID)
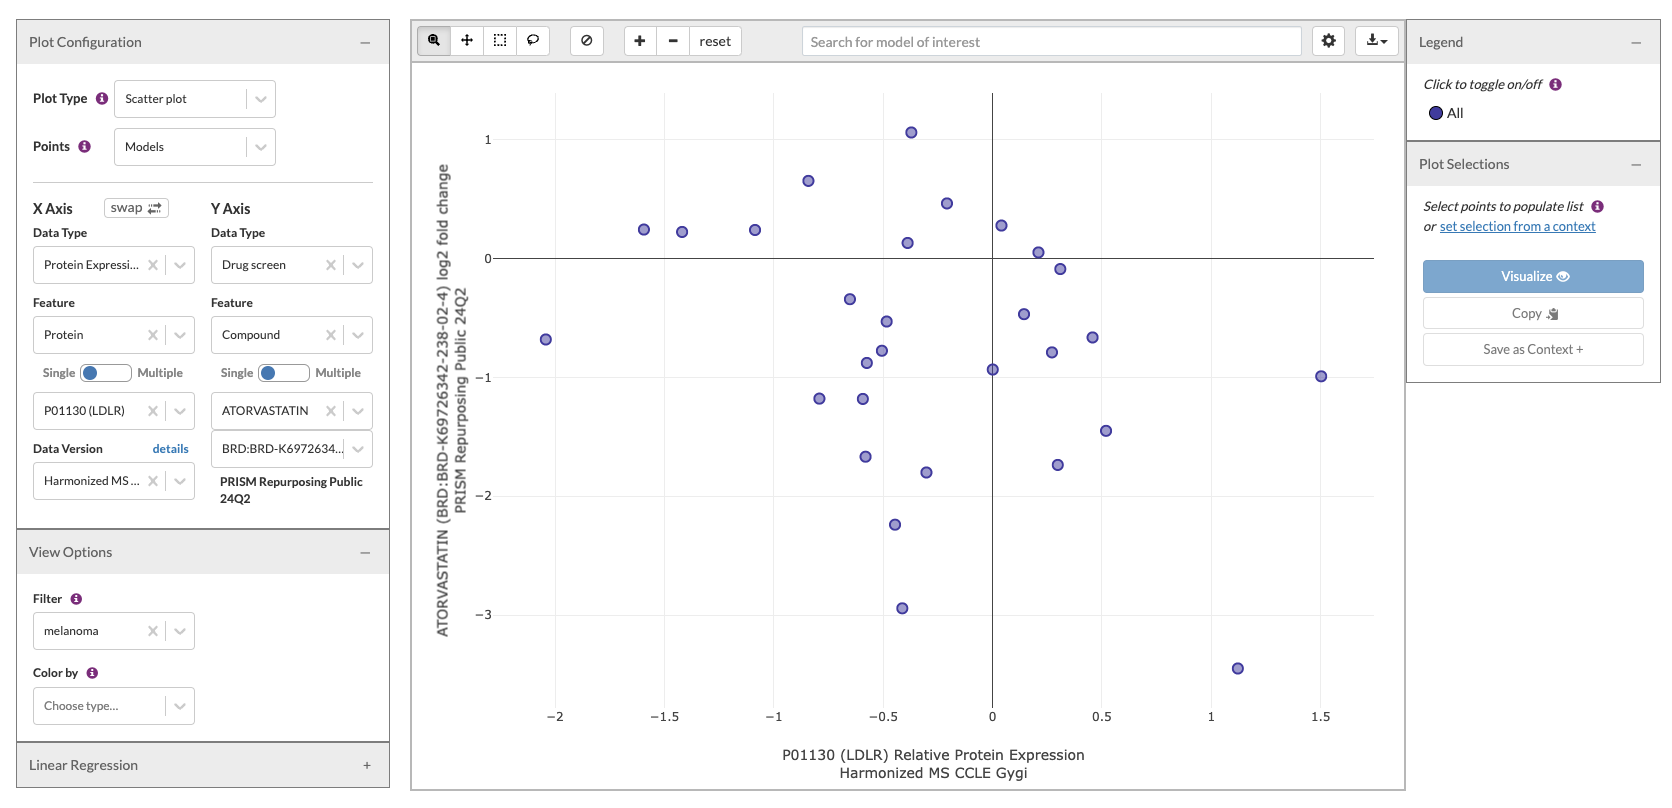
I believe I generated this plot in Data Explorer 2. You can see my selections on the left as a guide for how to recreate it:
Dear Friend, Sorry I am not aware of your name. Yes, this worked for me. I am wondering what are these values on these axes means? For example what does a value of -0.3 means for Atorvastatin, I think it is at the scale of Log2. On X axis, does a value of LDLR 1.5 means 1.5 fold change/increase??? With best regards and thanks, Vaibhav (VJ)
