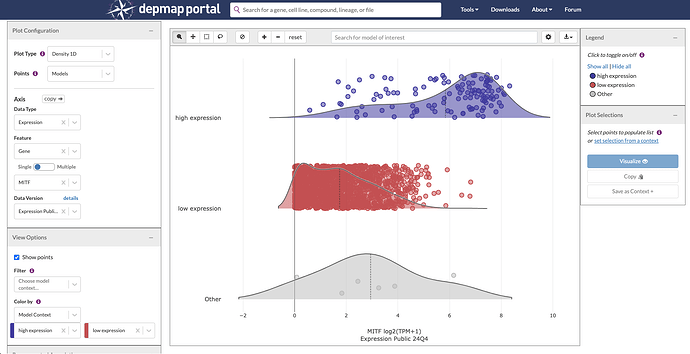
I would like to know how to use data explorer to make a plot of Gene A expression between high Gene B expression and low Gene B expression.
The way you’ve said high and low “Gene B” expression, makes me think you want something like a box plot for comparing the two groups of lines.
While Data Explorer doesn’t have boxplots, you can define two groups and compare the distributions.
So, you’d say you want to color by contexts and define a “high” and a “low” expression context. I’ll use SOX10 as the gene that I bin into high and low, and MITF as the gene whose distribution I want to compare:
Create a new context:
Now, I say this context is lines where expression is > 6
And I do a similar thing picking expression < 2 for “low expression”
And now I can plot a density plot of MITF expression “colored by” the two groups


